5.3 Answer of the system to one various politics of the waited for orders
Interesting to observe the behavior of the system adopting one various politics of forecast of the question.
In particular it can be observed as the supply is behaved chain using the function “Slidingaverage” (medium piece of furniture)
applied to the variable “Change in expected orders”.
The function gives back to the average of the Input on a data period of time.
The period of time for which it has been applied the average of the values assumed from the variable “Change in expected orders”
is of 20 weeks.
This politics have been applied are to the model with chance variation of the orders, are to the model with unexpected
increment of 20% of the question.
5.4 Comparison between the simulation models.
The scope of this chapter is that one to study the two models of simulation end hour examines (that one with unexpected increment
of 20% of the question and that one to you with chance variation of the orders) in the various political of forecast of
the question, that is that one to up to now seen pursuit, and that one to average mobile.
- Model with increment of 20% of the question: tables of comparison in the two tipologie of forecast of the question.

As famous from the diagram and the table of comparison the substantial differences between the two political of forecast of
the question can be searched analyzing first and the second part of the simulation:
- For the first sei-sette months approximately, using the mobile model to average, the warehouse is always maintained to a level more low regarding that one of the model to pursuit;
- In the months succeeded to you, instead, a completely opposite course has itself, that is the warehouse studied with the mobile model to average grows in wider way regarding that one analyzed with the model to pursuit;
- To the end of the simulation, however, in both models the warehouse catches up the same level, wished par to that one of approximately 48 widgets.
Various politics of management of the question, therefore, do not produce variations in the attainment of the objective, that is
that one to assure an adequate level of warehouse, but in the modalities with which such objective it comes achieved.
For which the company it can decide, to second of the modalities of supplying of the materials, of the times of working,
etc to maintain itself more low to a level than warehouse in the first months of management in order then to carry itself to a level
higher than that one wished in order to compensate the deficit it begins them (case of the mobile model to average),
or to choose one political more graduates them based on which, after an unavoidable decrease it begins them, had to the unexpected
increment of the question, the level of the warehouse grows gradually until catching up the wished level
without never to exceed it (case of the model to pursuit).
The comparison between the levels of the warehouses assumed during the simulation is useful in order to estimate the operating costs
of the supplyes.
An other interesting comparison, using the two political of forecast of the question, is that fact on the backlogs like
index of the number of the products withdraws to you and therefore of the degree of dissatisfaction of the customer.
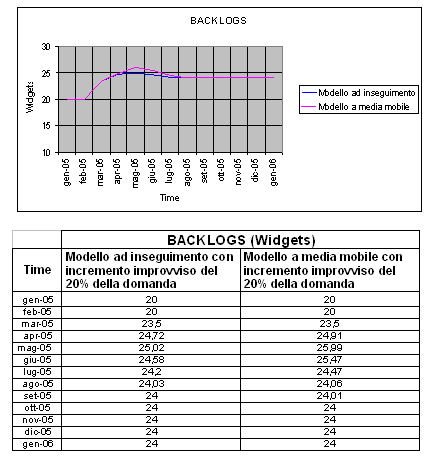
From the diagram and the famous table of comparison that using one political of forecast of the mobile question to average,
in the part more high centers them of the simulation is caught up a level of products in backlogs (the 26 widgets) that in
the case to pursuit (25 widgets); such difference then is cancelled in the final part of the simulation in which the for both
models number of back orders door to you to an equal constant value to 24 widgets.
Model to chance variation of the question: tables of comparison in the two tipologie of forecast of the question.
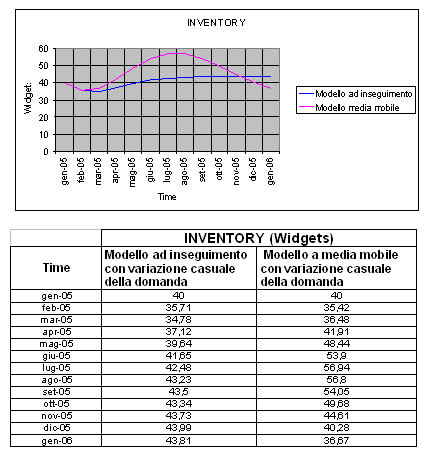
From the diagrams and the table of comparison some differences in the adoption of the two political of forecast of
the question for the model to chance variation of the orders can be deduced:
- Using the famous model to pursuit that, after they begins and unavoidable decrease of the warehouse, which had to the completely accidental variation of the question, the company recognizes that the varied question in a narrow range (between 10 and 12 widgets/week) and ilivello of the warehouse it begins to grow chasing and catching up the wished level;
- Using instead, the mobile model to average happens that the waited for orders do not have an ascending course like in the event to pursuit, but oscillates in a range comprised between 10 and 12 widgets/week assuming values that are the averages of the orders attended in the considered period (20 weeks); consequently also the level of the warehouse has a similar course. After a decrease it begins them, the level of warehouse grows catching up a maximum of approximately 57 widgets (when the waited for orders catch up the peak of 12 widgets/week) going over the wished level. After that it begins to decrease coming down to of under of the wished level. If the period of simulation grew tall it would notice that the waited for orders would oscillate in a more and more narrow range around to 11 widgets/week, while the peaks minimums and maximums of the level of warehouse would be always approached more the wished level.
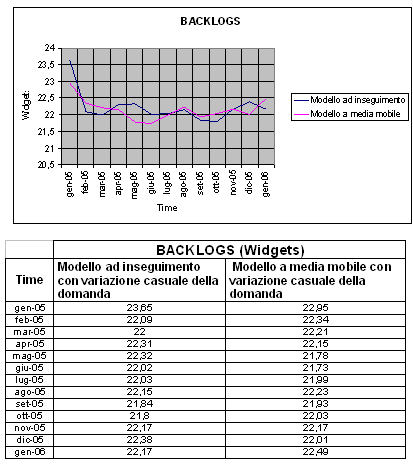
From the diagram and the table of comparison evince that I use it of the two political different of forecast of the question in the event of chance variation of the orders of the customer do not behave substantial differences in the management of the backlogs.