2.2 Instruments and rules of the System Dynamics
System dynamics uses a set of instruments that allow the professionals to visualize and succintamente to represent
mental models of a system, to communicate those models to the others and to increase the understanding of the systems.
Not there is a single formula for the use of everyone of these instruments, but there is a number of suggestions that can help
to clear and to allow to understand the power of theirs use.
The simulations of the dynamic systems are based on the principles of cause and effect, feedback (feedback) and delay (delay).
Some simple simulations incorporate one or two of these principles; more sophisticated simulations use all and the three principles
in order to reproduce behaviors that are met in the real world.
Cause and effect are a simple concept; it means substantially that it sets in action and decisions have consequences.
The price influences the sales, the births influences the amount of the population, the publicity influences the market.
If these relations of cause are taken an examination and effect isolatedly, is easy to understand. However when cause chains
of and effect are arranged in long they can become complex.
This is an optimal reason in order to use the simulation. The human mind is good in developing intuitions in order to resolve complex
problems, but it is poor in monitorare dozens, hundred, migliaia of interconnections and relations of cause-effect.
Causal-loop diagrams: often they are used in order to illustrate the relations cause-effect. In such diagrams they are used of the arrows
in order to indicate relations.
Sometimes, in the diagram, the regarding information are included also the way in which the relations they work.
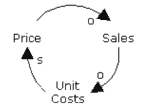
“Or” added in the diagram it implies a “change in the opposite direction”. In the relation between price and sale, a price
increase induces to one reduction of the sales. The relation between births and population is various from previous in how much
an increase of births implies a population increase. This last one is a situation in which a change it induces to an other change
in the same direction. In order to indicate that one “s” to the arrow in the diagram joins.
Figure 2.1 extension a simple one causal-loop diagram in which the price it has an effect negative on the sales that in its turn an effect
has negative on the unit cost that in its turn has a positive effect on the price.

Figure 2.1 - A simple one causal-loop diagram that it illustrates the logons between price, sale and unit cost.
Feedback is a concept that many persons associate to the microphones and loudspeakers.
A microphone that is not shaped in appropriate way will collect the coming from sound from its same loudspeaker.
This sound will come amplified ulteriorly from the loudspeaker and collected newly from the microphone.
This process goes ahead until the loudspeaker that is producing sounds amplifies can make it to you or the microphone cannot collect
ulterior sounds amplifies to you.
If the microphone and the loudspeaker were it sets up the system correctly to you would work linearly.
This is the general principle of feedback. Some chains motives are connected so that cause and effect ripercuotono
one on the other. This happens everywhere in the real world in all the types of systems, although the persons of are not
often aware.
To fix the competitive price is a feedback example. Every fixed vendor the price basing it on that one of the just
concurrent one and therefore via.
Simple causal-loop diagram figure 2.1 illustrates the feedback like approval in the price example and sale.
If a strategy were used in order to fix the price based on the costs, it could be shown that as they increase the sales, the unit cost
for product comes down. As the unit costs come down, the prices decrease also.
If the price comes down, the sales go up.
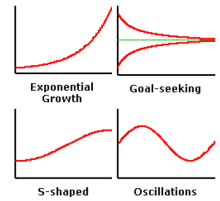
Relations of feedback can produce a great variety of behaviors in the real systems and the simulations of
the real systems. Figure 2.2 extension four common behaviors created from several feedback cycles.

Figure 2.2-Quattro common behaviors created from several feedback cycles.
Exponential growth. (Example:one population of rabbits);
Goal-seeking behavior. (Example:number of employs to you in the force-job and number of new employs to you; number of upgrades them purchasers and new sales);
S-shaped behavior. (Example:dynamics of the cycle of life of a product; the acceptance of one revolutionary scientific idea);
Oscillations. (Example:oscillation of the inventory).
All the relations of cause and effect do not happen instantaneously. Some time the consequences of an action or decision
do not appear until many days, months, years after the accadimento of an event.
Difficult to understand a system when the consequences cannot be seen in proximity of the behavior.
Many decisions have consequences that cannot be known for years and they cannot never be connected to the first errors.
Delays can produce interesting and complex behaviors in the systems also when they do not have feedback and limited
complexity of cause and effect. In order to illustrate this it can be still watched the example of price and sales.
The unearned income for a line of products is determined multiplying the prices with the sales.
Increasing, therefore, the price or the sales will be an unearned income increase.

Figure 2.3-Diagram that illustrates the effect of the sales and price on the unearned income
The demand for usual is influenced from the price even if not immediately. The customers can demand time for regulating
their models of consumption after a change of price. This can happen because they have imperfect information on
the alternatives or the infrastructure that are forcing them temporary to a specific one chosen.
In this case the connection between price and sale differs from that one introduced in the causal-loop diagram previous for
added of one the delay (delay) like shown in figure 2.4.

Figure 2.4-Effect of the change on the sales it is illustrated from a delay.
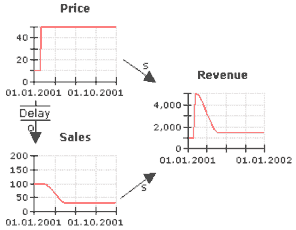
Since not there is delay between price and unearned income, when the price variation happens, before what that happens is that
the unearned income knows them. Eventually, however, the consumers are able to correct their models of consumption and the sales come down
provoking low unearned incomes.
The behavior of the unexpected variation of price and the ollowing changes in the sales and the unearned income can be seen
in figure 2.5.

Figure 2.5-When happens an unexpected variation of price, has an immediate increment of unearned income. Since it comes been involved a delay (delay), the sales will not decrease immediately. After a sure time, however, the sales will fall, giving as turned out an unearned income decrease.
To understand the concepts of cause and effect, feedback loops, and delays offers a good base when it is begun to discover
the complexity of the nature of a system - which elements are acting on other elements and if the interaction is positive or negative.
The feedback cycles, however, do not indicate by themselves what it will be the behavior of the entire system.
Difficult to anticipate the behavior of a system from a causal-loop diagram that it represents the retroactive structure
of a single system.


